A little more awareness. A lot more flow.

Your AI usage.
Always in sight.

Keep quotas, tokens, and costs in view. A local backend and a desktop companion, built for the way you work.

Windows · macOS · Linux · Free & open source

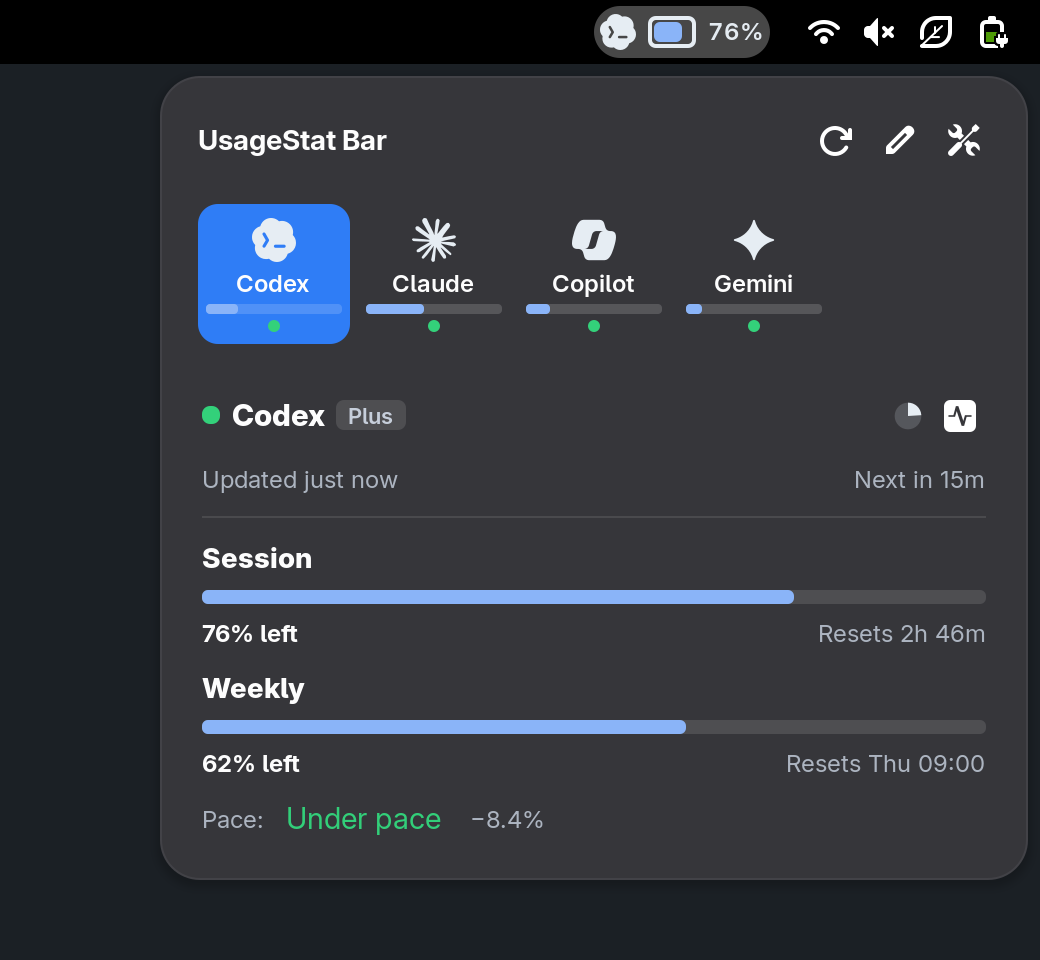
UsageStat Bar running in GNOME Shell. Codex Plus. Session: 76% left. Resets 2h 46m. Weekly: 62% left. Resets Thu 09:00.
Current GNOME UI Sample data

Select a provider in the capture to explore.

Codex. Session: 76% left. Resets 2h 46m. Weekly: 62% left. Resets Thu 09:00.

ALL YOUR TOOLS. ONE CLEAR PICTURE.

ClaudeCodexCursorCopilotGeminiOpenRouterAll providers

ONE TOOLKIT. TWO WAYS IN.

At a glance.
Or under the hood.

One place to bring your providers together.
Two ways to make that information yours.

THE BACKEND

UsageStat

The quiet engine behind the numbers. Fetch provider usage, automate your checks, and build on a consistent local API.

your terminalbash

# A quick check, wherever you work.

usagestat usage claude

# Structured output for your scripts.

usagestat --json usage claude

# Your providers, through a local API.

curl 127.0.0.1:6736/v1/usage

CLI · background daemon · HTTP API
  • JSON & CSV exports for your own workflows
  • Local dashboard and optional background polling
  • JavaScript provider plugins and T3 Code integration

Explore the backend
THE DESKTOP COMPANION

UsageStat Bar

A small addition to your panel. Keep your limits nearby, check your next reset, and get back to what you were doing.

Make your panel yoursCURRENT GNOME VERSION
Actual GNOME panel: Codex pinned beside Claude, with a logo, two stacked usage meters, and a percentage each.

Codex pinned beside Claude, with a logo, two stacked usage meters, and a percentage each.

Captured from the extension with sample data. Configure your own layout in UsageStat Bar preferences.

  • Usage meters and reset countdowns in your panel
  • Choose providers, placement, colors, and order
  • Windows system tray and macOS menu bar
  • Native panels and trays across all Linux desktops
Explore UsageStat Bar
UsageStat Bar reads directly from the UsageStat CLI.
01 / LOCAL

Your machine.
Your usage.

Run the backend locally. Provider checks use your configured accounts, and cached usage stays on your machine.

02 / FLEXIBLE

A home for
your whole stack.

From Claude and Codex to Ollama and OpenRouter. Enable the providers you use and add your own through plugins.

03 / OPEN

Small tools.
Open possibilities.

Both projects are MIT licensed. Read the code, contribute a provider, or use the backend to build something of your own.

Make yourself at home.

Install the backend, connect your providers, and add Bar to your desktop.

Install UsageStat

A FEW GOOD QUESTIONS.

Before you
settle in.

Do I need UsageStat Bar?

No. UsageStat works on its own as a CLI, local dashboard, and HTTP API. UsageStat Bar is an optional desktop interface to the same backend.

What about other Linux desktops?

UsageStat Bar now supports Linux desktops through native widgets, system trays, Waybar, and Polybar. There are integrations for all 12 desktops and window managers in the demo, plus shared tray support for other desktops with a StatusNotifier host. See the desktop support table.

Does this work on macOS or Windows?

Yes. UsageStat and UsageStat Bar work on Windows, macOS, and Linux. The installation page selects a starting option for your device, and you can switch systems whenever you like.

Will every provider show the same metrics?

Each provider exposes different information. UsageStat normalizes the available quotas, resets, credits, tokens, and costs. Some costs are estimates from local logs rather than billed amounts. Check the provider documentation for its supported sources and credentials.

Can I connect my own tools?

Yes. Use JSON or CSV from the CLI, read the local HTTP API, or enable the optional CLIProxyAPI bridge for T3 Code. You can also create JavaScript provider plugins. Read the T3 Code setup guide ↗

BUILT IN THE OPEN. MADE TO BE YOURS.

Keep your flow.
Know your limits.

Get UsageStat Support the project